 |
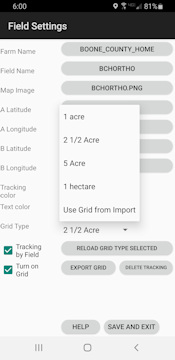
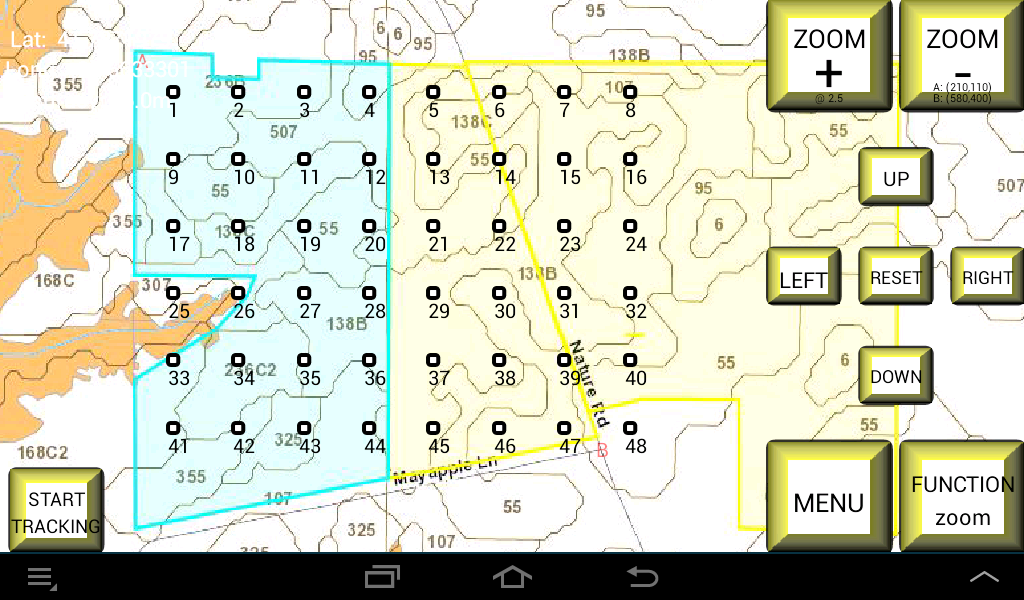
Options: 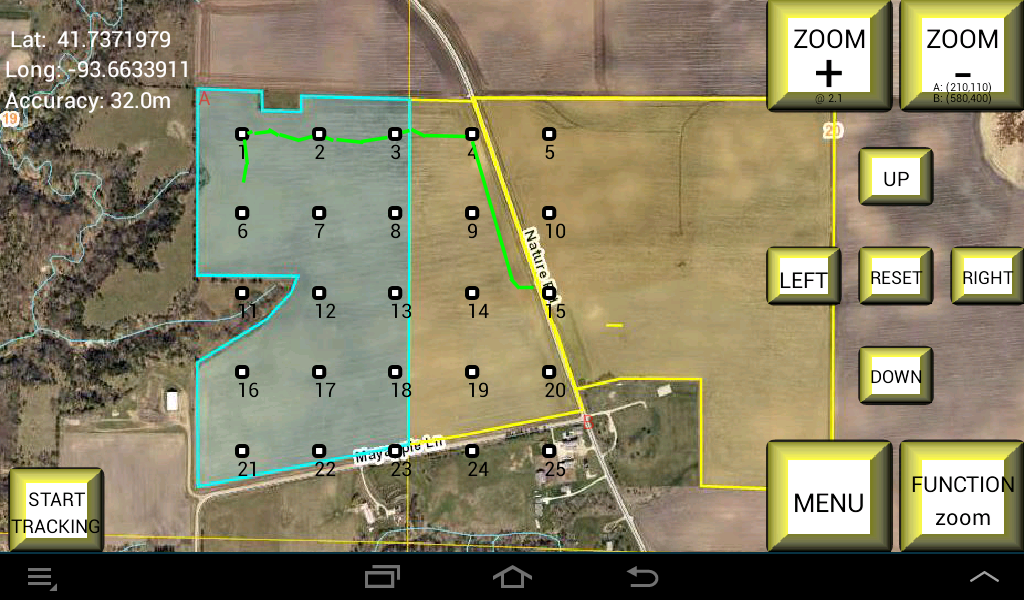 5 acre grid |
|
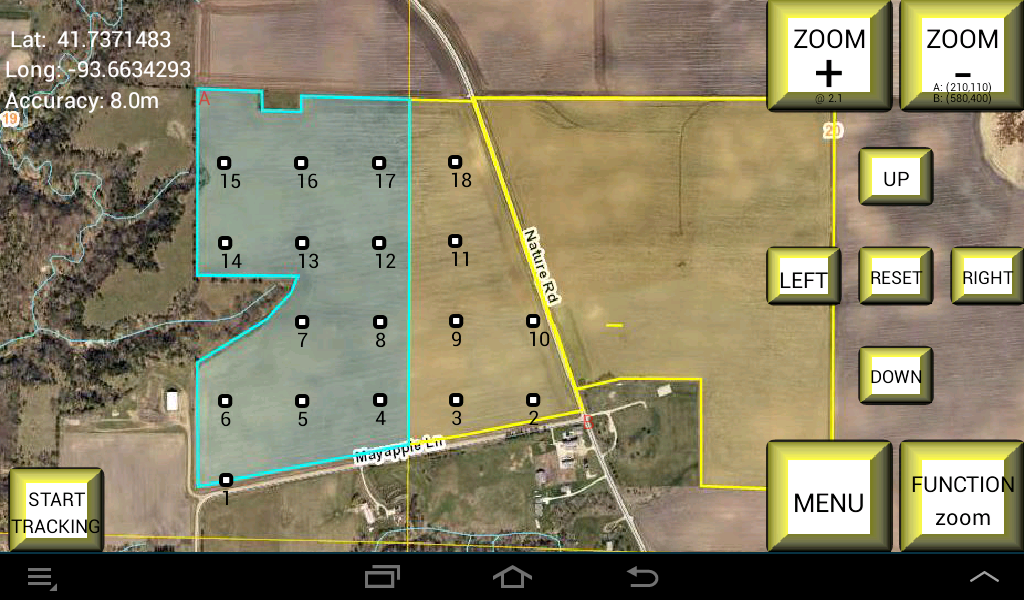
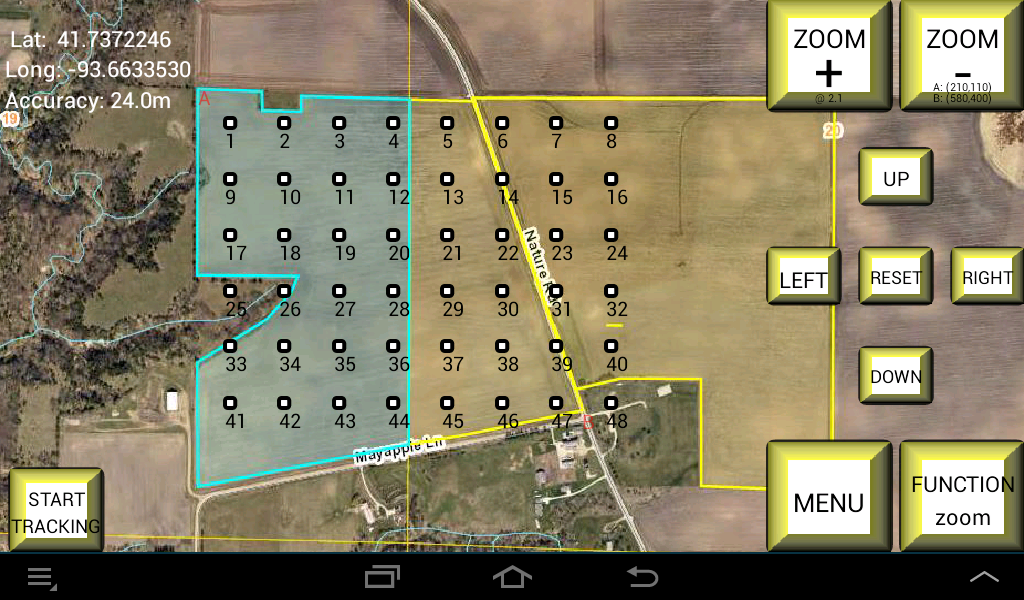 2 1/2 acre grid |
|
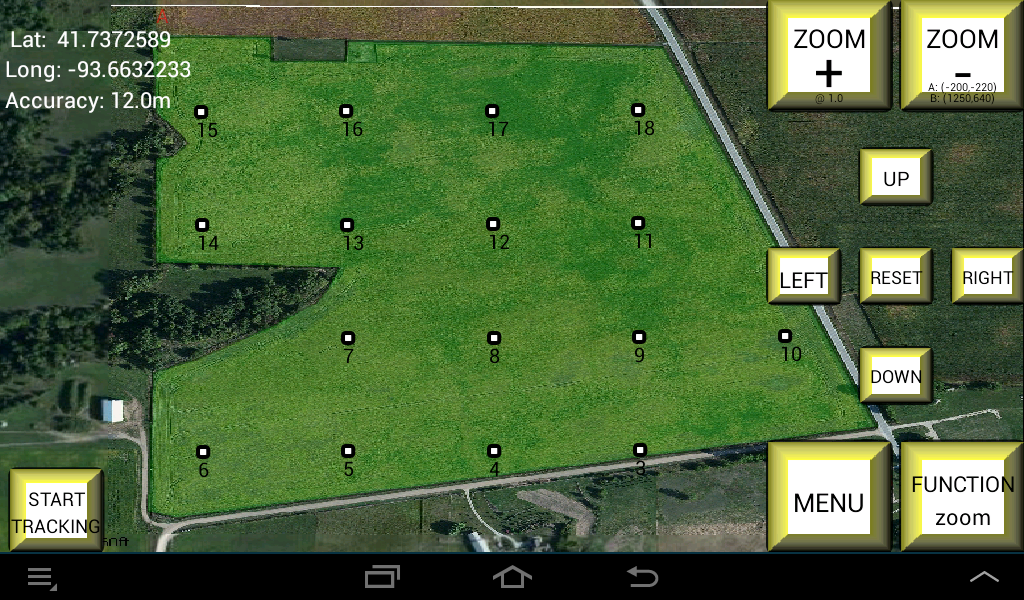
 Grid imported from SMS via CSV file |
|
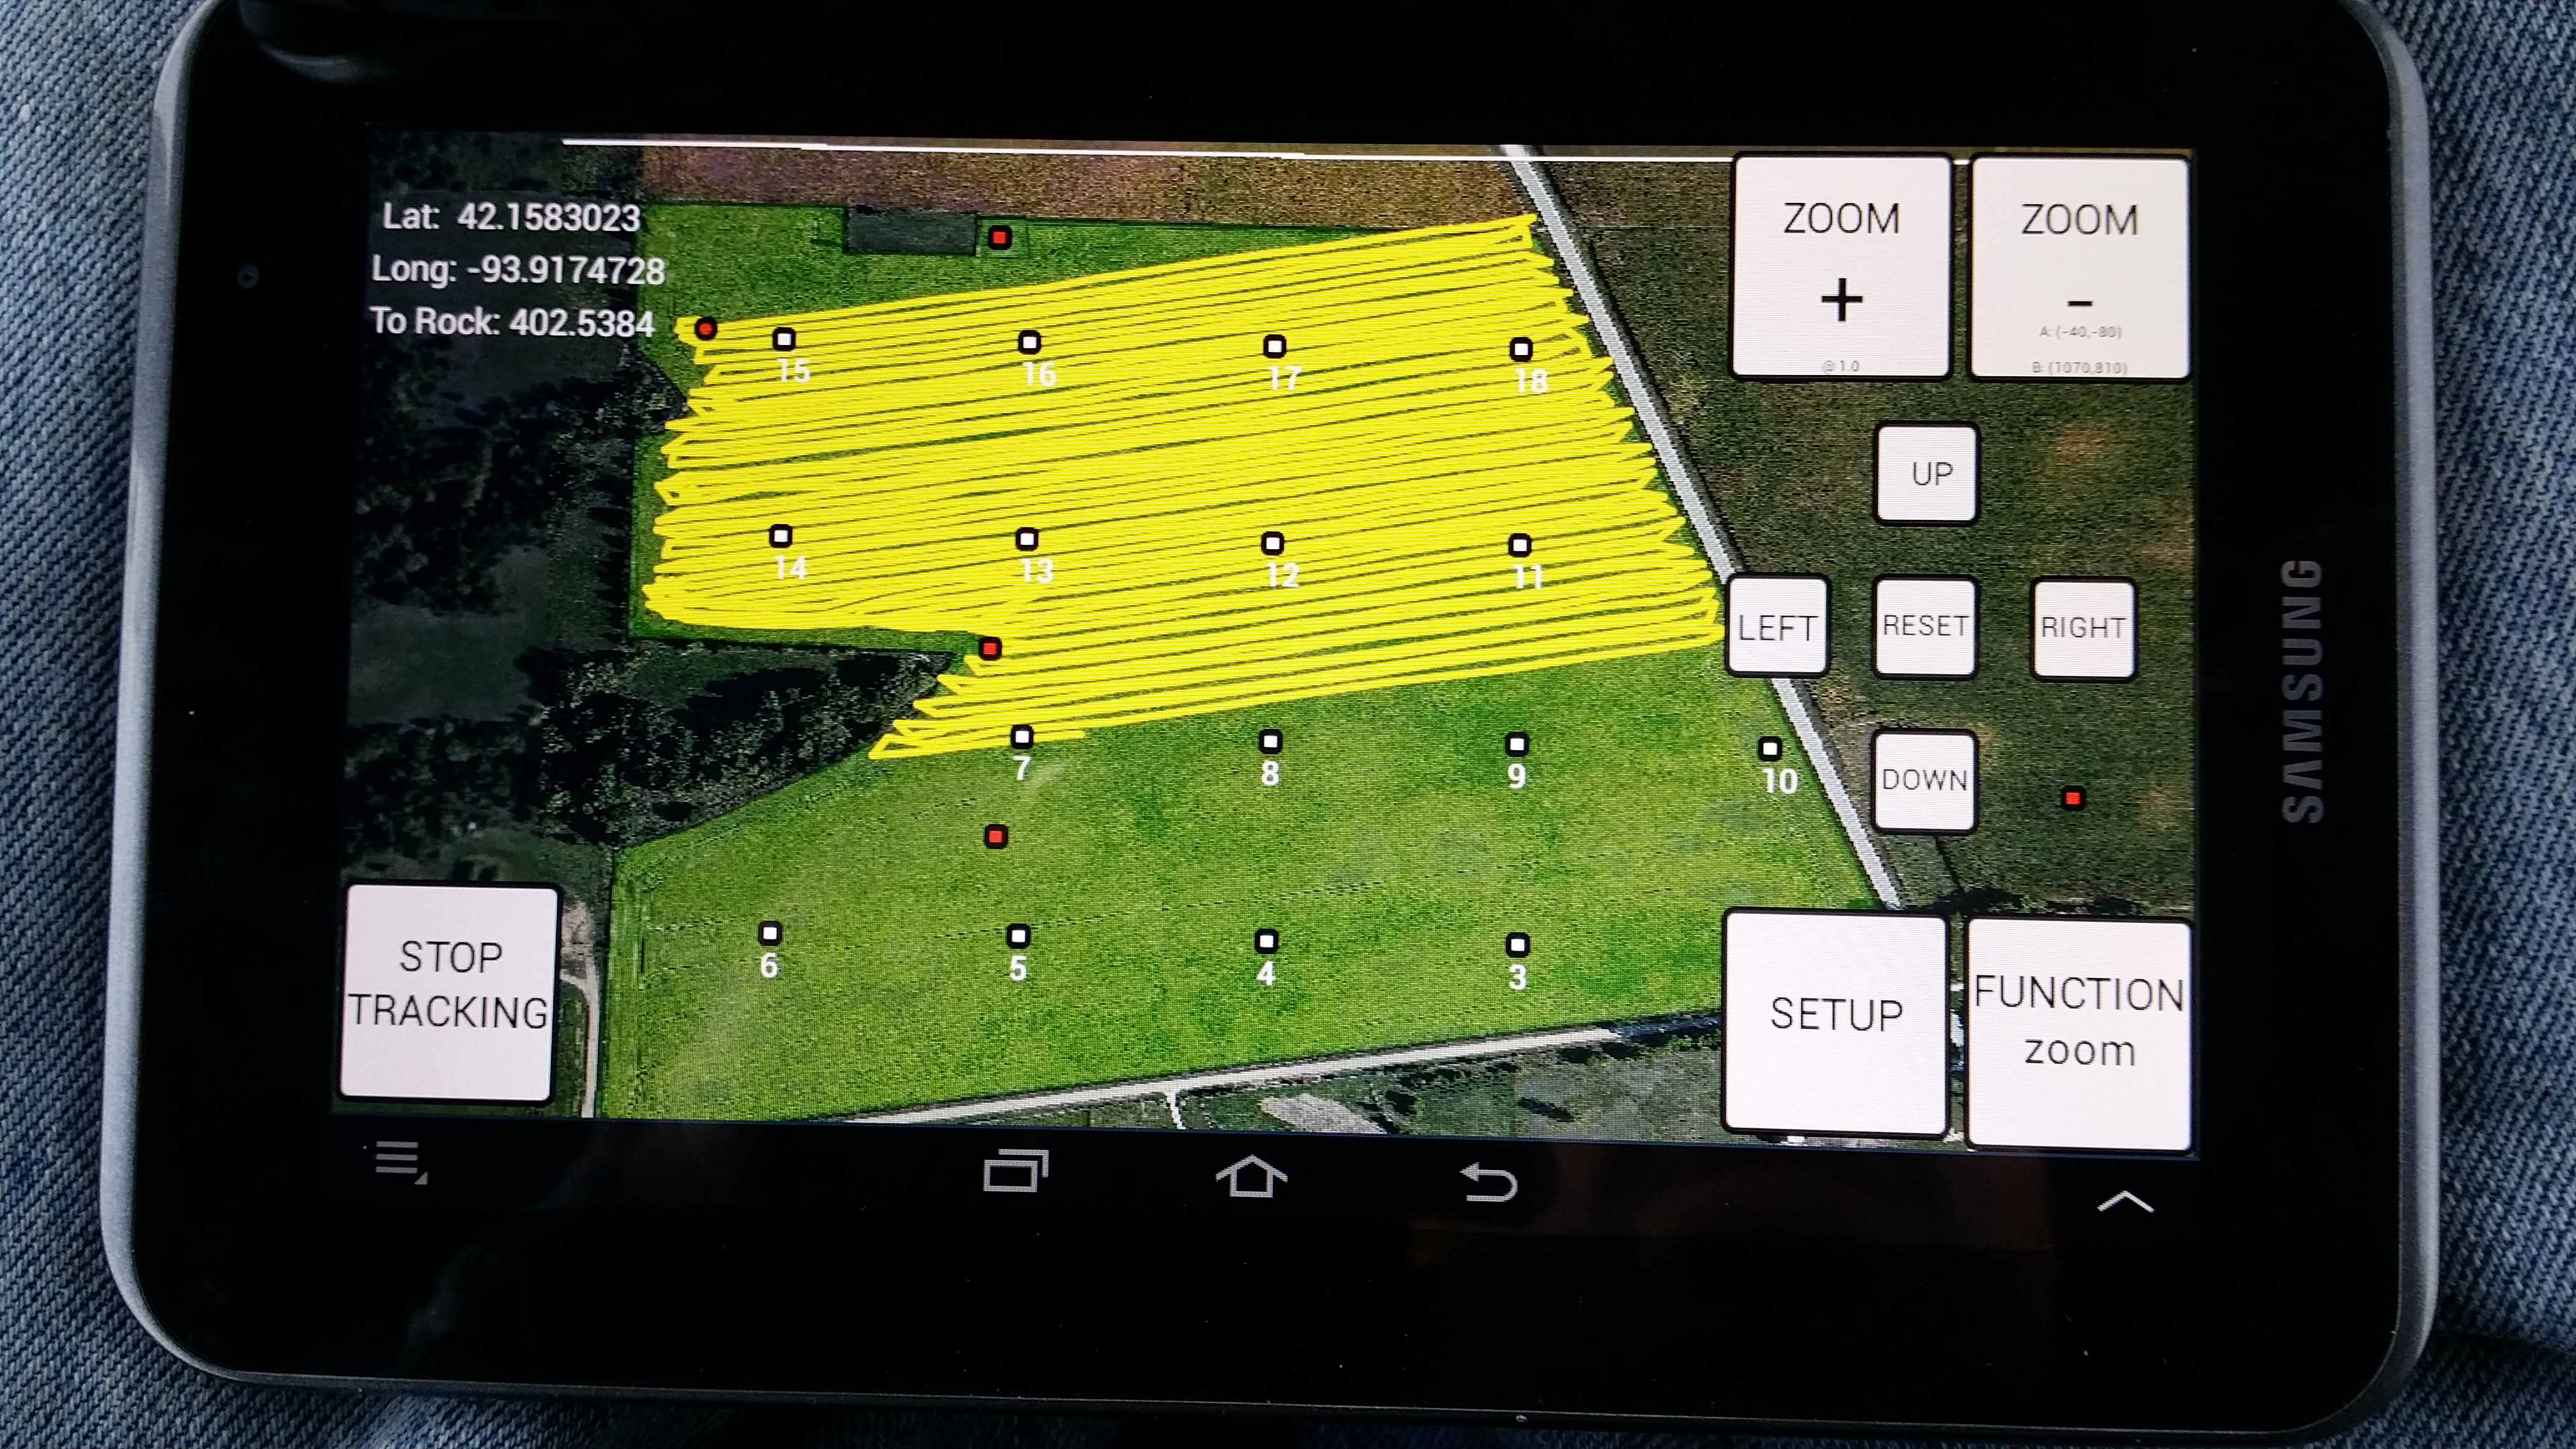
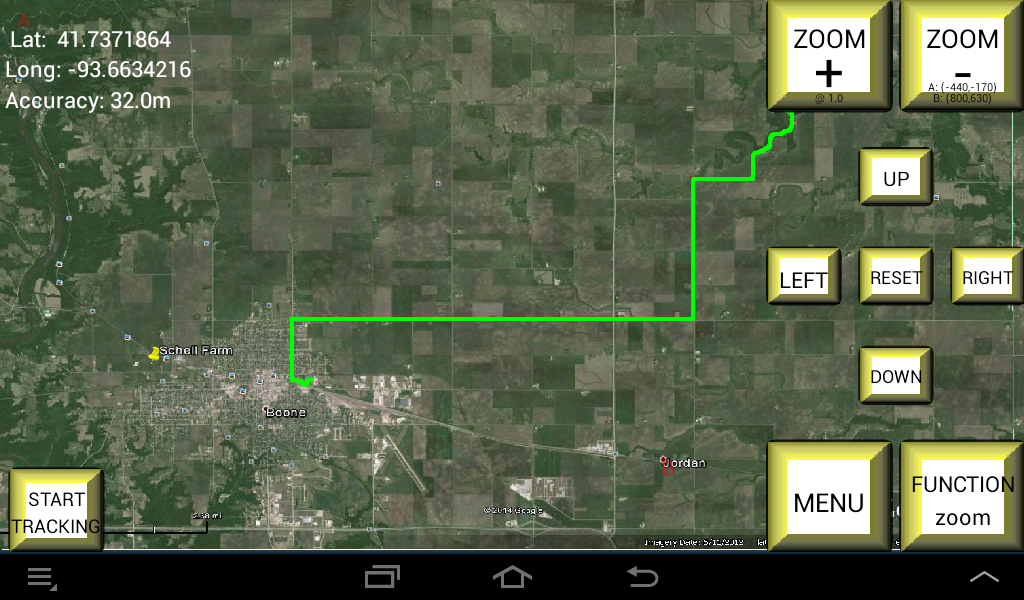
2020 version with next waypoint flagged. |
|
|
In the fall of 2013, I modified one of my programs to show me where to take soil samples. Since then I have been improving it and feel it could help
others to do their own soil sampling and save some money. (Used it again in 2014, 2015, 2016, 2017, 2018, 2019, 2020.)
The nice thing about my program is that it does not rely on cell tower reception and does not rely on Google Maps.
Above is a 5 acre grid, a 2 1/2 acre grid, and spots loaded from a popular ag software package - Ag Leader SMS Basic (TM).
The bottom screen shot (fall 2020)shows a flag indicating the next sample spot (also called waypoint). The flag can be moved ahead to the next sample spot with the Function Next WP key.
The white circle with the pointer turns on an audio feature that tells you direction and distance to the flagged sample spot (such as northwest 50 meters).
|
|
 |
|
 |
|
 |
|
|
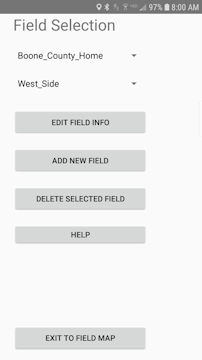
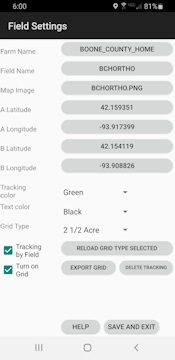
Here's how you use it: - Load a jpg or png picture of the field from Google Earth (TM), your county assessor's GIS system, a picture from a quad copter, etc. Put it in the tablet's Soil Sample directory with Android's MY FILES app - //storage//emulated//0//Android//data// com.outfarming.soil_samplev8. If the image is distorted, Press the Function button until is displays "stretch image". Press the LEFT and RIGHT buttons to correct the distortion. Press the Function button several times to return to Function Zoom. - Mark the upper left corner of your field with the red "A" on the map. Same thing with the lower right hand corner of the field with the red "B". You do this by pressing the Function button twice until "move A" is displayed. Then you press the LEFT RIGHT UP DOWN buttons to move the red "A" on the map. Press the Function button again to move "B". If you can't see the "A" or "B", press the "ZOOM -" button at the top right of the screen several times. Return the Function to "Zoom" after finished. - From the Field Settings screen, Set A & B latitude and longitude. Use Google Earth or whatever other source you have for these coordinates. - If you don't have access to the GPS coordinates, drive to "A" and use the GPS coordinates from the display on the main map screen. Do the same for "B". - From the Grid Options screen, turn the grid on and select what size grid you want from the drop down menu. As an option, you can load the sample spots from an ag software package using a csv file. - Return to the map. Your location will be marked by a red circle with a black ring around it. - Press the Start Tracking button and move toward your first spot. On the map you will see a trail of where you travel. - Make sure the Function button shows "zoom". If it doesn't, press the Function button until it does. Then you may zoom in, out, left, right, etc. |
|
Options: |
 |
 |
|
 |
|
 |
|
|
Some nice features of the Soil Sampling app: I use three different maps of my farm. An ortho map, a soil map, and a Google Earth(TM) image. I like to see the soil map to see where I am taking my samples in reference to where my soil types change. The ortho map gives me a clear picture of the field and happens to show tile lines. I also loaded a map of central Iowa and took my tablet on a 45 mile tractor ride tour - tracking where I had gone. A couple of years ago I used it while ripping a corn field and watched my progress. |
|
 |
 |
|
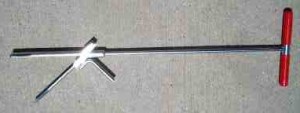
I've tried just a couple of tile probes. I like this one - the KHS soil probe. I found a link to buy them at a reasonable price
here.
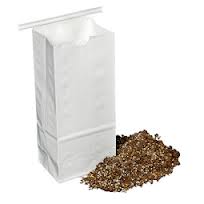
I drive to the sample spot and take 12 samples in a circle of about 35 feet, mix the samples together in a Folgers coffee container and dump them in the sample bag. Close it and mark the bag with the spot number from the map on my Android. I got the bags free from the testing lab that I used. I had saved the GPS coordinates to a csv file from my map using the export on the Grid Options screen. When I took the analysis to my local testing lab, I asked to have the results returned to me in a csv file. |
|
 |
|
|
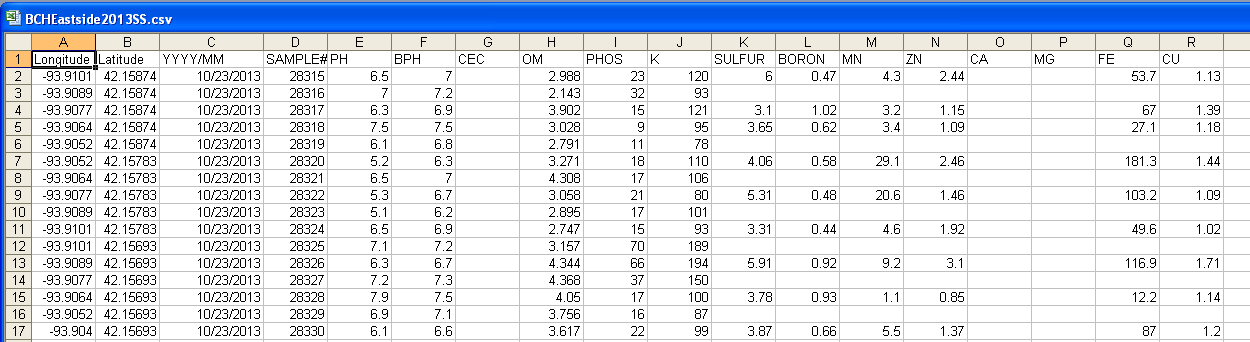
With a spreadsheet I merged the two files and imported them into the Ag Leader SMS (TM) software. See how here. (2018 fall: I dropped support for SMS and now use the free mapping software QGIS.) From there I produced the same reports, graphs, and maps that I would have gotten from the fertilizer company. But the big advantage was that I then made my own fertilizer prescriptions (shape files) (2018 - KML files) and gave to the fertilizer plant to have them apply the P, K, Zn, and S where I wanted them and at variable rates. I put down more K than had been recommended to me and less P and K over all. There were areas that I put down more P & K than recommended. Bottom line is that I spent less money on fertilizer than each of the previous years and got it where I needed it. The variable rate application cost me a dollor more per acre. How did I know how much I needed? I used the internet to search. I found good information from universities in Iowa, Illinois, and Wisconsin. See Iowa State University's "A General Guide for Crop Nutrient and Limestone Recommendations in Iowa." Search for "Sulfur Fertilization Response in Iowa Corn Production." And "Optimum soil test levels for Wisconsin." I chose to apply fertilizer to bring the levels to the optimum levels. The Iowa State document gave me the lbs./acre to apply. I selected three rates of P and K to apply based on the lab results. The ag software allowed me to make prescriptions from this which I brought to the fertilizer plant. 2014 Fall FYI: Phosporouse (M-3P test)- in areas where I had 0-8 ppm I applied 165 lbs/acre of DAP. 9-15 ppm got 120 lbs./acre. 16-20 ppm got 95 lbs./acre. Higher ppm got none. Potassium (dry test) - in areas where I had 0-120 ppm I applied 100 lbs/acre of Potash. 121-160 ppm got 80 lbs./acre. 161-200 ppm got 45 lbs./acre. A few acres got none. pH and Lime: The local generic recommendation is to put lime down every few years. The local fertilizer plant recommended that I put on quite a bit to bring the pH up to 6.5 in the top 6 inches for corn, 6.9 for soybeans. The soil test results also gave suggested lbs. of lime to apply to each sample area. I was preparing to put on lime. The evening after talking to the fertilizer plant the first time, I went back to reading the "Crop Nutrient and Limestone Recommendations in Iowa". I saw that their instruction recommends the same 6.5 BUFFER pH for most areas in Iowa except in some specific areas with high pH subsoil which includes where I farm. For this area they recommend bringing the Buffer pH to 6.0. When I read that I went back to the soil test result recommendations and found that they had recommended the identical lbs. of lime for the 6.5pH area, not my 6.0 pH area. Looking at my soil test buffer pH results, I saw that I didn't need to apply any lime. Almost my whole farm had good pH. So I found another good reason to know your own farm and analyze your needs yourself. Forward to fall of 2018: Last winter I went to the Hefty Brothers AgPhD Soils Clinic and the their Advanced Soils Clinic. These taught me how to evaluate soil sample reports and develop my own prescriptions. This was the first time I could find answers to how much N, P, K, S, Zn, B, Ca, Mg, Mn, Fe, Cu is needed for optimum yields. Tremendous! Thanks sooo much Hefty Brothers! I also use their AgPhd Soils Fertilizer Removal app on my phone. |